
Digital
Transformation
Readiness
Tool
Guide Book
This page assumes that you are familiar with the Digital Readiness Framework. If not, you can review that information here.
The first two questions we are always asked are:
- How do I use the tool?
- What do the collectors and report look like?
We will answer both of those questions on this page.
How Do I Use the Tool?
You are interested in the tool because you believe that your organization must be ready to transform. Well, if you want to get the best possible results from this tool, then your organization must be prepared to participate in the data collection.
Based on years on using this toll with organizations, we have developed a process that we highly recommend you follow.
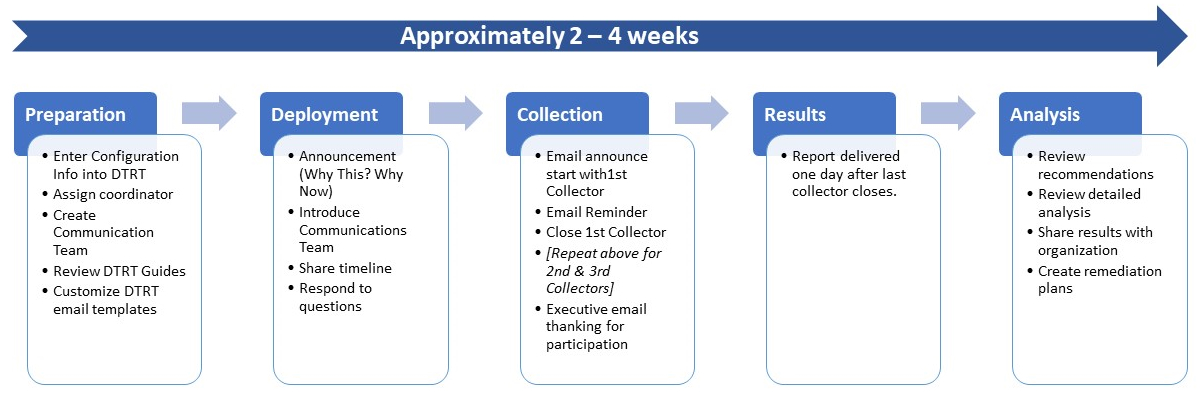
As you can see there are five distinct phases in using the tool.
Preparation:
After purchasing the tool, you will be asked to complete a few on-line forms to supply information about your organization. This allows the tool to be configured based on your demographics and organization structure.
Next you should review the DTRT guides about communication with your organization. In addition to the guides, multiple email templates are supplied. We recommend that you assigned a coordinator, create a communications team, and customize the templates before proceeding.
Deployment:
Now that you have completed all the customization, it is time to tell your organization about the tool. Start with a “Why This? Why Now” email from the senior executive. You had a number of reasons for deciding to use this tool, share them with your organization. The more they understand the reasons, the higher the participate and the better the responses.
This phase is all about two-ways communications. Your people are going to have concerns and questions. Make sure that they are addressed before moving to the next phase
Collection:
Based on the option you selected, you will have 1 to 3 collectors. We highly recommended that you leave each collector open for a minimum of four business days that span a weekend. We also recommend that you close the collector after six business days and spread the collectors out over multiple weeks. Leaving them open longer does not significantly improve the response rate. And running three collectors simultaneously, results in fatigue and decreases participation.
Communications during this phase is critical. Respond rapidly to any issues or questions that arise.
Results:
As soon as the last collector closes, the system starts the analysis of the data and begins the creation of the final report.
One business day later, the report is delivered to the executive sponsor.
Analysis:
Your people have invested time in providing you data. As soon as possible, you need to share high-level results with them. Until your do, they will be anxious about what is going to happen. It is OK to tell them that you are still planning on which improvements will be addressed. Even better, solicit volunteers to assist the in reviewing the results and planning the next steps.
What Do the Collectors Look Like?
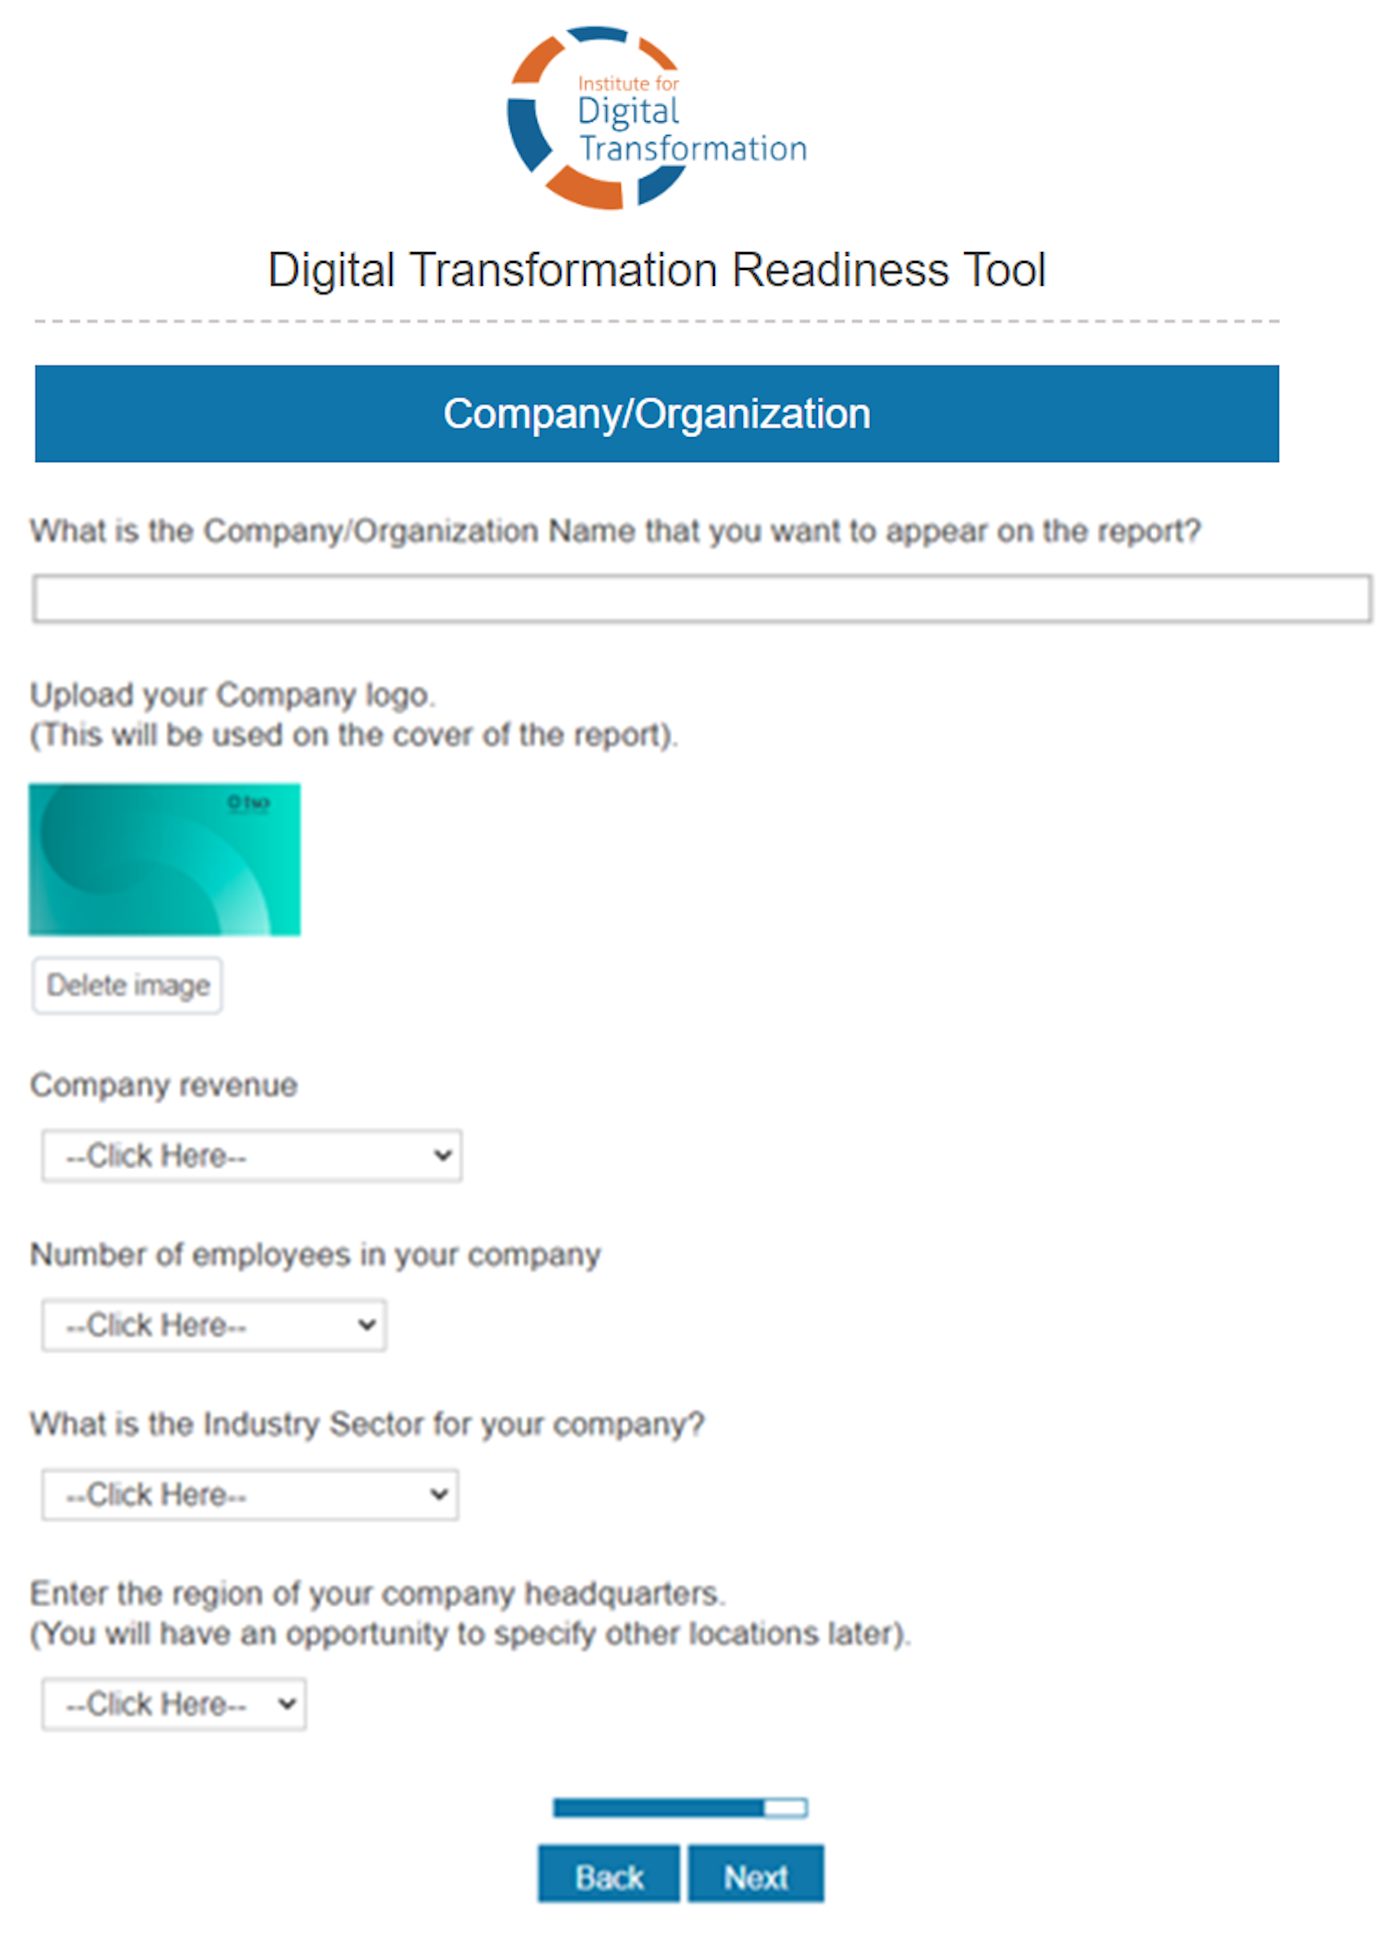
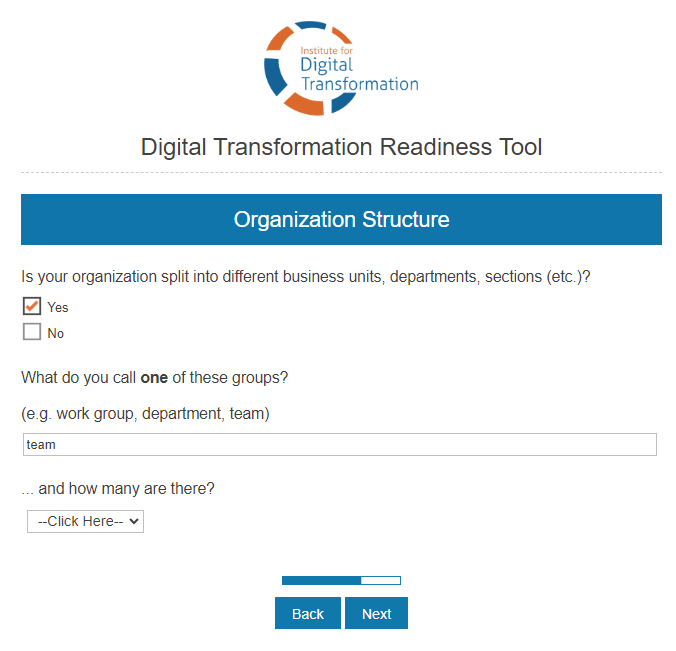
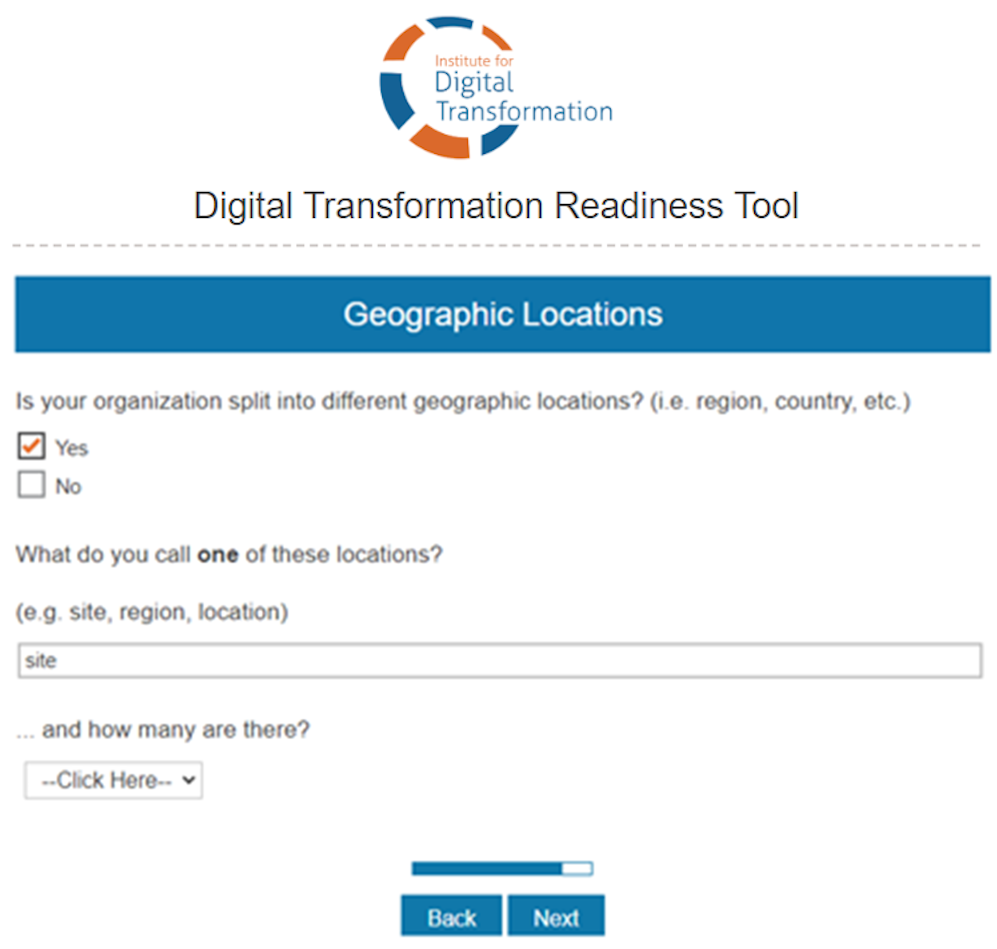
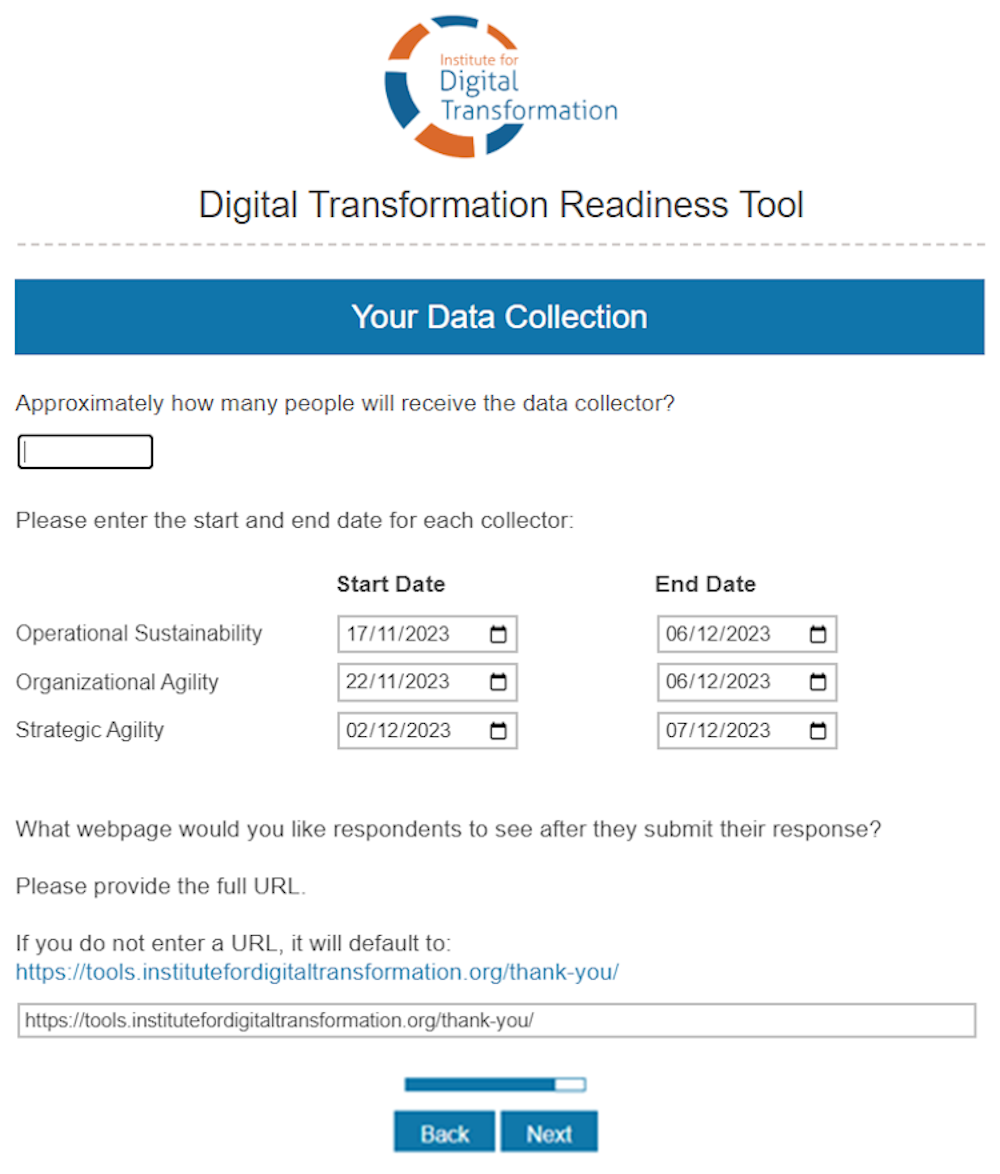
Configuration Screen:
In the Preparation phase, we mentioned that you will need to provide information about your organization. This information is collected by a tool called Qwizard. These are the screens you will be using to configure your Organization’s data collectors.
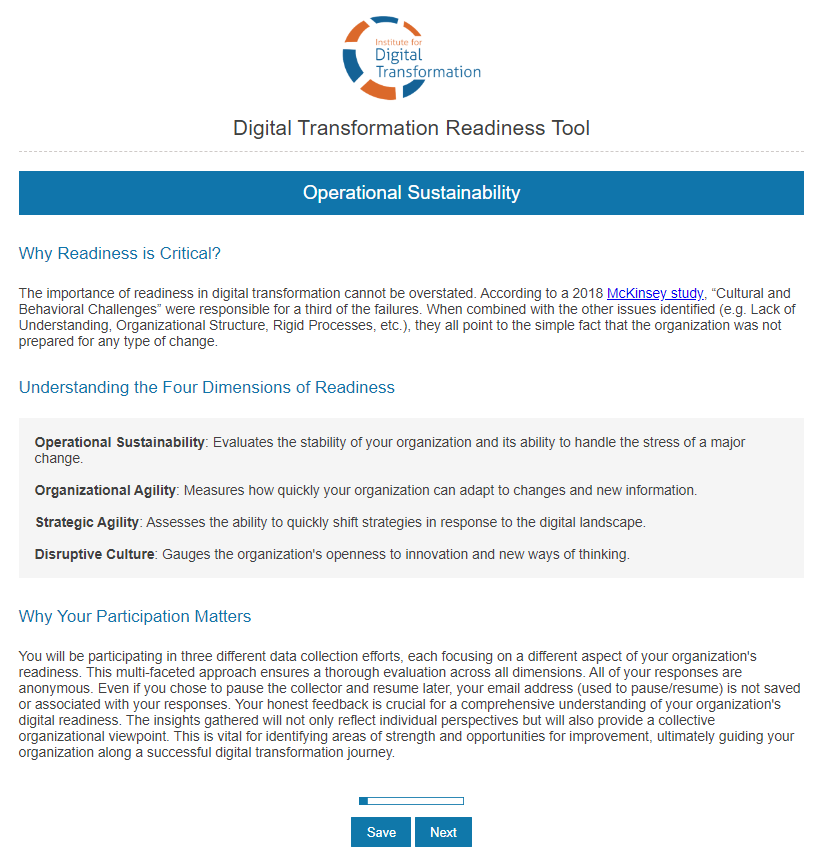
Data Collectors:
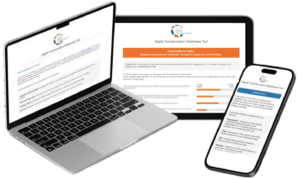 A key benefit of the DTRT Data Collector is that they can be accessed from almost any device that has a web browser and an internet connection. This allows your people to provide feedback one any device at any time.
Another key benefit is that people are able to pause their responses and resume them when they have more time. (Each collector will take approximately 15 minutes to complete.) At the bottom of each screen, they can hit save and get a unique URL to resume their session. They can even have this URL emailed. (NOTE: The email address is NOT saved with the collected data. This ensures anonymity of the responses.)
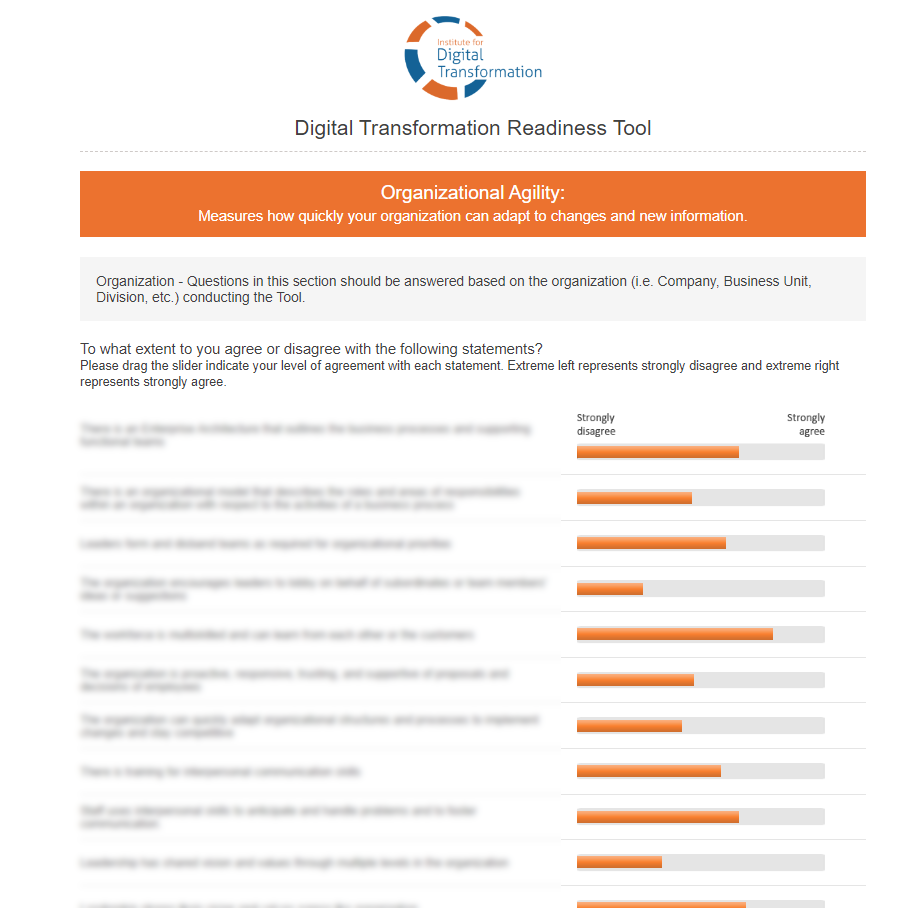
Each Data Collector has a different color associated with it: Operational Sustainability is blue, Organization Agility is orange, and Strategic Agility is purple. This helps different what type of data is being collected.
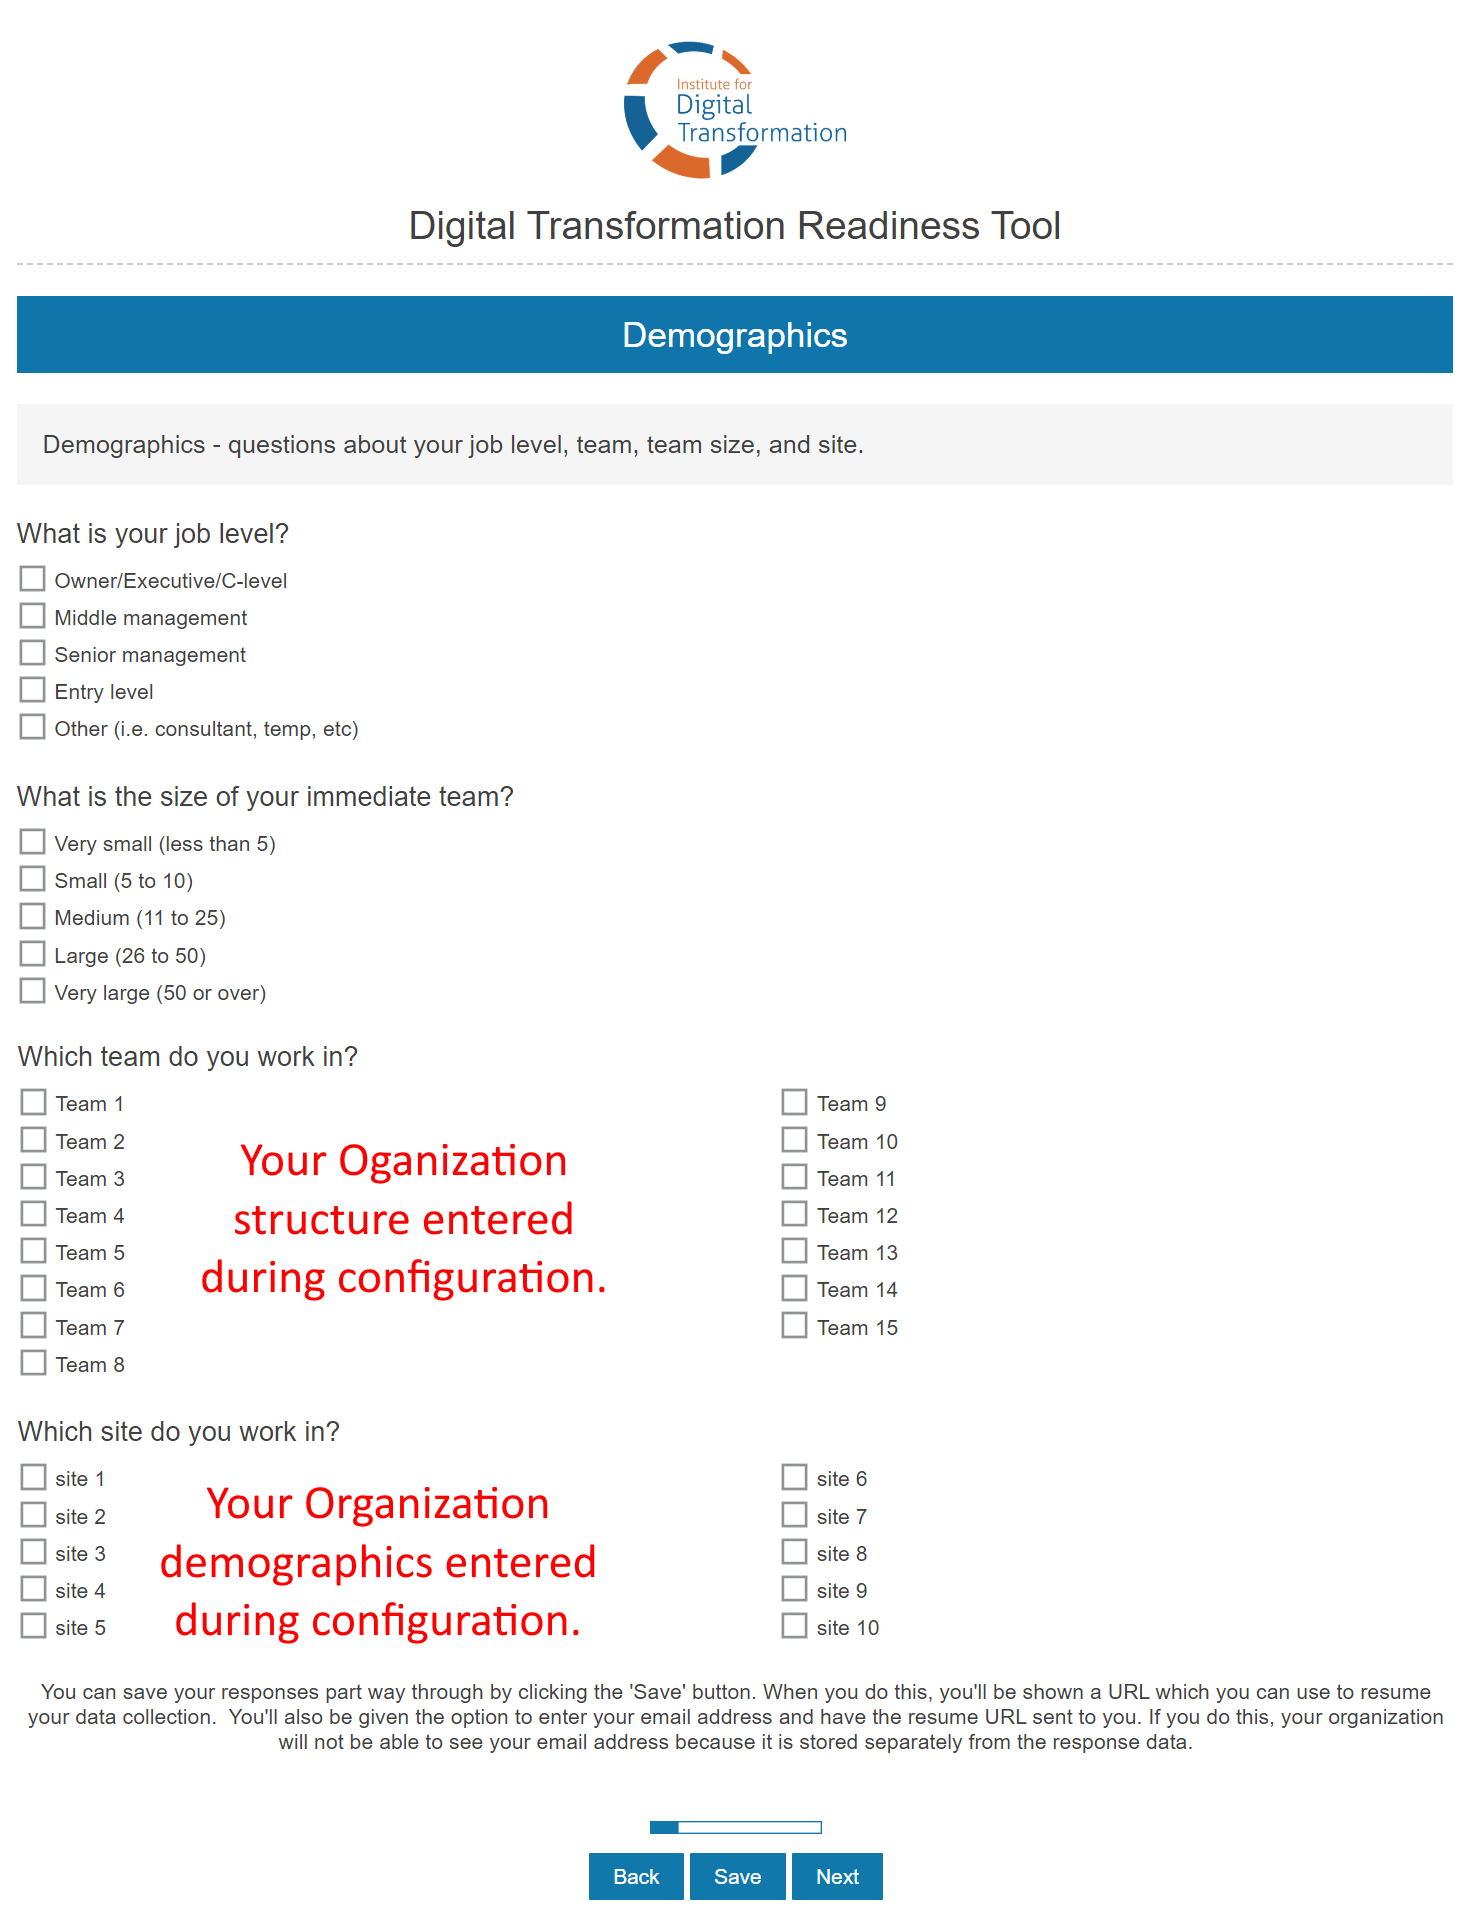
In each Data Collector, there are five screens of responses. The first screen is for Demographics. The next four screens did the responses into four areas: Organization, Team, Self, and Baseline. The following are examples of what people will see:
Interpreting the Report
It is import that you understand how to interpret the report. This is not the standard maturity model or scorecard. Yes, you will receive numeric scores, but it more important they you first understand your organization’s level of Readiness.
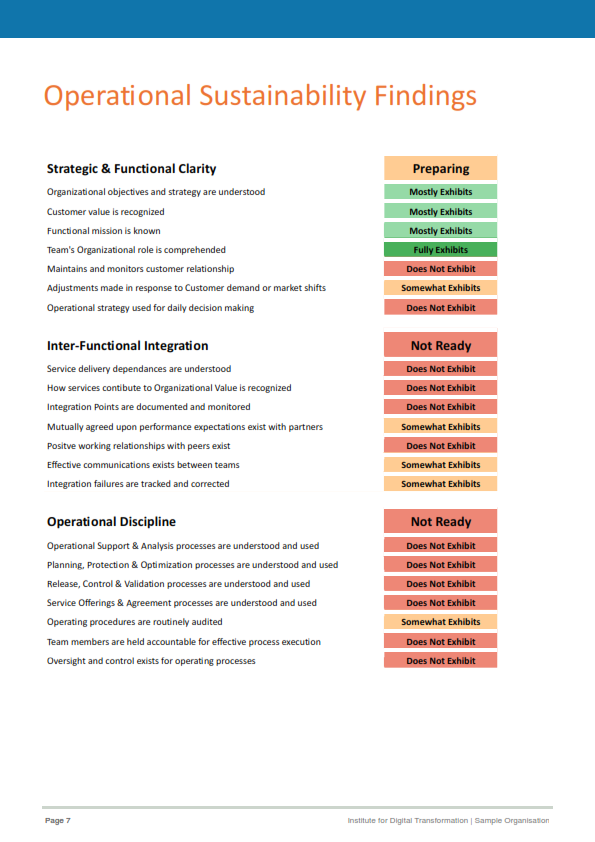
The first three Dimensions ( Operational Sustainability, Organizational Agility, and Strategic Agility) are broken down into seven Attributes. Disruptive Culture has nine Attributes. Each Attribute will receive one of three scores:
Your organization lacks the readiness to execute a transformational effort in this area. This is typically indicative of an organization that operates at least partially in silos, has limited or insufficient communication capabilities, manages in an ad-hoc manner and will have difficulty making the rapid, yet cohesive decisions and shifts necessary during a digital transformation effort. The organization will likely be unable to effectively handle the pressures of transformational efforts while maintaining on-going operations. Organizations with any characteristics in this state should consider delaying significant transformational efforts until they have improved their readiness in these areas.
Your organization is operating in ‘middle ground’ in this area. There are indications that management, communications, and decision making (among other attributes) are potentially sufficient to handle the pressures of a transformational effort, but risk remains. Organizations should closely evaluate any area with this classification and determine if they feel they will be sufficiently able to execute transformational efforts while maintaining ongoing operations and meeting other operational demands. If only one or two areas are in this category, targeted mitigation efforts will probably be sufficient to enable the organization to move forward with their transformational efforts. If the majority of areas are in this state, the organization should work to improve the organization’s overall readiness before proceeding.
Your organization is operating in a manner in which there is open communication, collaboration, structured management, effective decision making and other attributes that indicate that it will be able to effectively handle the pressures of a transformational effort while maintaining the operational state. Nevertheless, the organizations should not move forward with significant transformational efforts unless the vast majority of the characteristic areas are in this state.
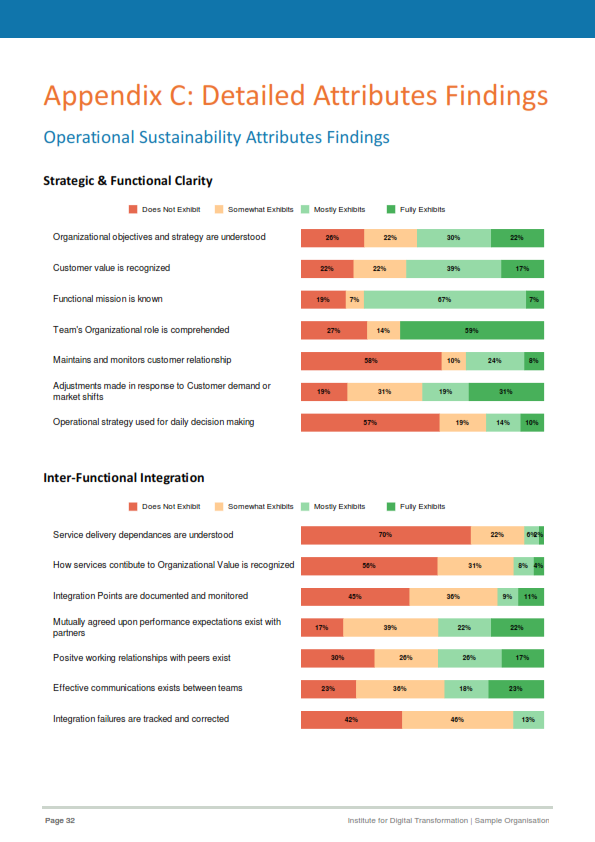
In addition, each Attribute is further broken down into seven Characteristics. Characteristics will fall into four different categories which will also display a percentage of the results.
This refinement of the results allows your organization to focus their improvement efforts into specific activities. In the same way network performance tools allow engineers to pinpoint potential problem areas, Characteristics can be used to fine tune your improvement efforts.
It is not necessary to have results of all Fully Exhibits in order to be successful. Every organization needs to review these results in conjunction with their strategic business objectives to prioritize their improvement programs. A combined score of Mostly Exhibits and Fully Exhibits that is over 60% indicates that no or minor improvements efforts are required in this area.
Results of greater than 30% of Does Not Exhibit are areas for examination. Especially if when combined with Somewhat Exhibits the result is greater than 50%.
Characteristics should only be are used to fine-time your improvement efforts. The main focus of your imporvement efforts should be based on your results in Attributes.
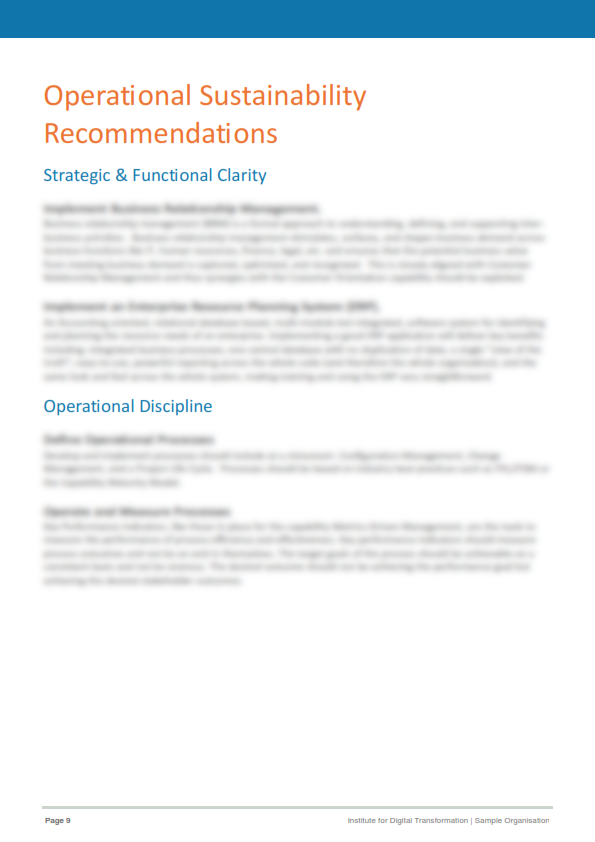
Sample Report Pages
The DTRT Comprehensive Readiness report is approximately 40+ pages long. We will be showing you some sample pages to show what is in the report.
Summary
Everything you have seen on this page is just a sample to give you an idea of how to use the tool, the collection screens, and how the results are presented. After purchasing the tool, you will receive access to a resource page with detailed usage guides and templates.
Questions?
Use this link to schedule time with the creators of the Digital Readiness Framework and Digital Transformation Readiness Tool.
OR
Ready to Purchase?
Use this link to take you to the purchase page to select the option that best suits your needs. By purchasing the tool from the Institute, you have the option of adding 60 days of advisory services after you receive the report.